Absorption rate is a quick method to gauge a market’s selling pace and the balance between supply and demand. Put simply, it measures how quickly homes sell in a market over a specific period, assisting participants in determining when to list, how to price, and how aggressively to negotiate. In practice, it also underpins months-of-supply estimates, informs appraisals and underwriting, and shapes development timing and investment strategy. Because it captures market tempo, shifts in absorption ripple through pricing power, marketing timelines, and deal terms. Below, we define absorption rate clearly, show how to calculate and interpret it, and explain how buyers, sellers, agents, developers, lenders, and appraisers utilize it to make better, data-driven decisions. For a deeper understanding, see our guide to absorption rate in real estate markets.
Key takeaways:
- Absorption rate gauges how quickly inventory sells, signaling supply–demand balance and negotiation leverage.
- Two core views: percentage absorption ((Sold ÷ Active) × 100) and months of supply (Active ÷ Average Monthly Sales).
- Benchmarks: under 15% = buyer’s market; 15%–20% = balanced; over 20% = seller’s market.
- Used across roles for pricing, marketing cadence, development timing, underwriting, and investment strategy.
Understanding Absorption Rate in Real Estate
Absorption rate measures how quickly homes sell in a market over a specific period. It’s a practical indicator of market absorption and the property absorption “speed limit,” signaling the selling pace and, by extension, the leverage dynamics between buyers and sellers. This concept applies to both residential and commercial real estate; in leasing markets, professionals also track gross and net absorption to understand true demand. As a market tempo indicator, absorption affects inventory (months of supply), pricing strategy, and negotiation leverage, making it a core metric for timing entries, exits, and capital allocation decisions.
How to Calculate Absorption Rate
The standard approach is straightforward: calculate the absorption rate by dividing the number of homes sold by the number of homes for sale, then multiply by 100 to get a percentage. For example, 100 homes sold ÷ 1,000 listings = 10% absorption rate. These conventions are commonly used by practitioners and brokerage guides.
Alternative view: estimate months of supply by reversing the relationship—divide current active listings by the average monthly sales pace. Equivalently, when your absorption rate is measured monthly, Months of Supply ≈ 100 ÷ Absorption Rate (%).
Two practical ways to run the numbers:
- Percentage absorption rate
- Choose a time window (e.g., last 30 days).
- Count properties sold in that window.
- Use current or average active listings for the same period.
- Compute: (Sold ÷ Active) × 100.
- Months of supply
- Compute average monthly sales (e.g., trailing three months).
- Use current active listings.
- Compute: Active ÷ Average Monthly Sales.
Example:
- Sold last 30 days: 100
- Active listings now: 1,000
- Absorption rate: (100 ÷ 1,000) × 100 = 10%
- Months of supply: 1,000 ÷ 100 = 10 months (or 100 ÷ 10% = 10)
Interpreting Absorption Rate Benchmarks
Absorption rate benchmarks help classify market conditions:
- Below 15% generally signals a buyer’s market.
- Between 15%–20% suggests a balanced market.
- Above 20% typically indicates a seller’s market. These ranges reflect how practitioners read supply-demand tension in day-to-day pricing and negotiations.
Remember, local dynamics can push rates well beyond typical bands—above 60% in hot micro-markets or below 5% in oversupplied areas—so always contextualize results by submarket and price tier.
Market interpretation reference:
- Buyer’s market: Under 15% — inventory builds, longer days on market, buyers gain leverage.
- Balanced market: 15%–20% — steady pricing, normalized negotiations.
- Seller’s market: Over 20% — faster sales, limited concessions, stronger list-to-sale ratios.
Applications of Absorption Rate for Real Estate Professionals
Market Assessment and Pricing Strategy
High absorption signals faster sales and stronger pricing power for sellers; low absorption indicates a slower selling pace and enhanced buyer leverage. Agents use this to:
- Set and adjust list prices to match current demand.
- Plan marketing cadence and expected time on market.
- Calibrate negotiation strategies (e.g., concessions, deadlines) as conditions shift.
- Leverage AI-driven pricing tools to refine recommendations as market absorption changes.
Development, Underwriting, and Investment Decisions
Developers monitor absorption to time new phases or starts, minimizing the risk of bringing supply into a softening market. For investors:
- Elevated, rising absorption can favor short-term flips due to quicker turnarounds.
- Consistently high or stable absorption supports buy-and-hold strategies via reliable leasing or resale velocity. Lenders incorporate absorption into market and credit risk assessments to gauge exit risk and loan exposure. Absorption trends also inform:
- Rent growth projections (tight supply + rising absorption = firmer rent trajectories).
- Feasibility studies (absorption thresholds for pre-sales, lease-up timelines, and break-even analysis).
Appraisal and Financing Considerations
Real estate appraisers use absorption rates to validate valuations and set realistic exposure times; slow absorption can flag oversupply, prompting tighter comps, longer marketing periods, or discounts. For financiers, deteriorating absorption may translate into more conservative loan terms—higher down payments, stricter covenants, or pricing for risk—while improving absorption can unlock more favorable rates and structures.
Limitations and Factors Affecting Absorption Rate Accuracy
Absorption rate is a snapshot—its meaning shifts with the chosen time frame, property type, price band, and submarket. Key constraints include:
- Sensitivity to time horizon and seasonality; short windows can be noisy.
- Blind spots for imminent listings, sudden rate shocks, regulatory changes, or migration swings.
- Data quality and timeliness (incomplete MLS feeds, duplicate listings, or delayed closings).
- Over-aggregation risk: national or regional figures can mask neighborhood-level realities; segment by asset type, price tier, and location for actionable insight. Pair absorption with months of supply to smooth volatility and cross-check conclusions.
Practical Tips for Using Absorption Rate in Market Analysis
- Triangulate metrics: combine absorption with months of supply, inventory trends, days on market, pipeline/new construction, and financing conditions.
- Localize and segment: calculate by submarket, property type, and price bucket; use rolling averages (e.g., 3-month) to reduce noise.
- Track inflection points: rising absorption + falling months of supply often precede price firming; the inverse can foreshadow softening.
- Role-by-role moves:
- Developers/investors: Pair absorption with demographic inflows and capital costs to time phases and size equity buffers.
- Agents/sellers: Use to set list price, predict time on market, and shape concession strategy.
- Buyers: Let absorption guide offer urgency, contingencies, and negotiation stance.
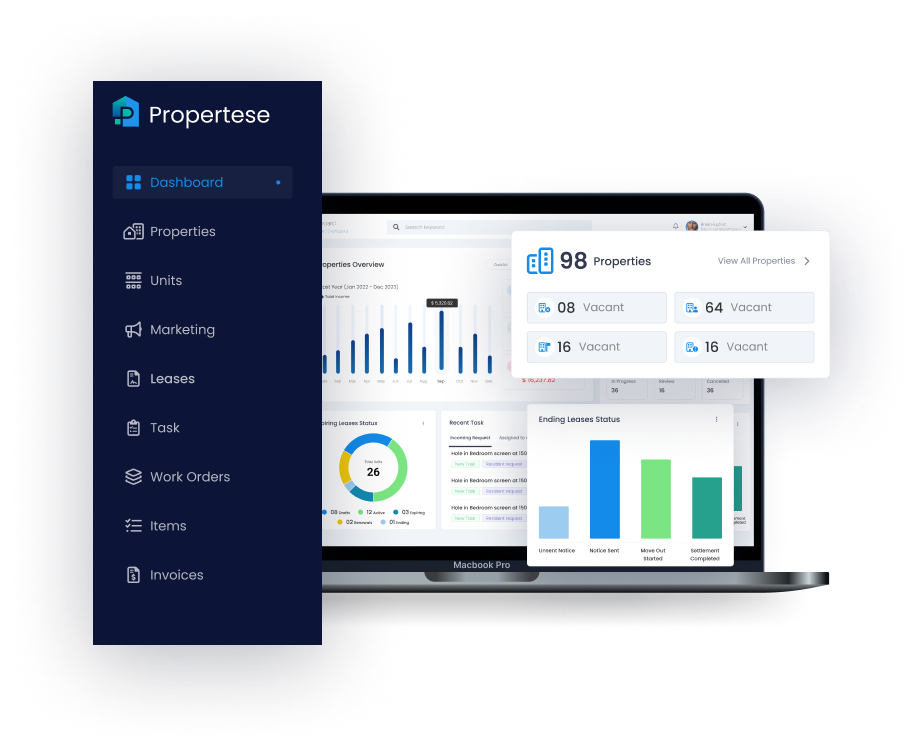
- Operationalize with systems: unify MLS, pipeline, and occupancy signals in a single view; platforms like Propertese can help teams track complementary metrics such as vacancy and occupancy alongside absorption to tighten forecasting.
Frequently Asked Questions
What Is the Difference Between Net Absorption and Gross Absorption?
Net absorption subtracts space vacated from space newly occupied, while gross absorption counts only new occupancy without deducting move-outs.
How Does Absorption Rate Impact Property Pricing and Negotiation?
Higher absorption boosts seller confidence and limits concessions; lower absorption favors buyers, encouraging more aggressive offers and contingencies.
Can Absorption Rate Predict Market Trends Accurately?
It’s a strong early indicator, but accuracy improves when using current, local data and pairing with corroborating metrics like months of supply and inventory flow.
Is Absorption Rate Relevant for Both Residential and Commercial Real Estate?
Yes—residential markets use it to gauge listing velocity, and commercial markets use absorption (often net/gross) to assess leasing demand and timing.
Conclusion
Absorption rate translates market activity into a clear, actionable signal. When tracked consistently and segmented properly, it helps real estate teams move from reactive decisions to structured, data-backed planning. Whether you are pricing listings, evaluating development phases, underwriting risk, or negotiating transactions, understanding absorption gives you measurable clarity on timing, leverage, and exposure.
However, the real advantage comes from monitoring absorption alongside inventory, occupancy, vacancy, pipeline, and financial performance in one unified system. When these signals are connected, forecasting becomes more accurate and operational decisions become faster.
If your team wants better visibility into leasing performance, occupancy trends, and real-time portfolio metrics, Propertese can help. Our platform is built for property managers, developers, and real estate operators who need structured reporting, financial control, and market insight in one place.
Contact us to see how Propertese can help you track the metrics that drive smarter real estate decisions.
Table of Contents
Stay Updated
Subscribe to get the latest news, industry trends, blog posts, and updates...