ASC 842 Compliance for Real Estate: What CFOs Need to Know
Key Takeaways
- ASC 842 requires real estate companies to recognize operating leases on the balance sheet as right-of-use assets and lease liabilities. This changes how lenders and investors interpret financial statements.
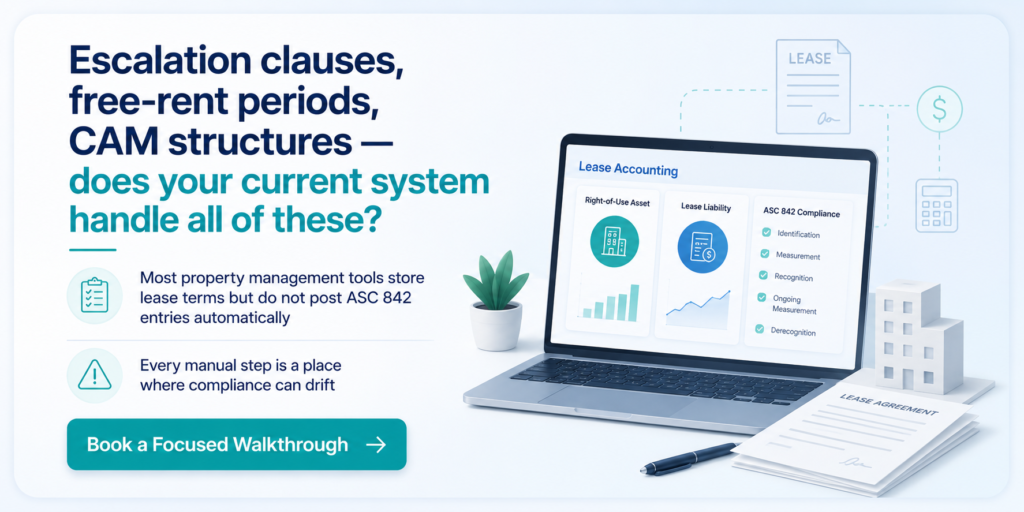
- Commercial real estate leases are harder to classify under ASC 842 than standard office or equipment leases. Escalation clauses, free-rent periods, and CAM structures all affect the lease liability calculation.
- Every lease modification, renewal, or early termination requires recalculating the right-of-use asset and lease liability. Tracking these changes in spreadsheets increases compliance risk as the portfolio grows.
- Most real estate portfolios include a mix of operating and finance leases. Incorrect classification affects both the income statement and the balance sheet.
- Propertese is built on NetSuite’s financial infrastructure. ASC 842 journal entries post directly to the general ledger whenever a lease event occurs, without a separate manual step.
In 2019, a large commercial real estate company discovered during an audit that seventeen of its ground leases had been classified incorrectly under ASC 842. The entries had been posted manually in a spreadsheet alongside the property management system. Nobody had caught the error because the numbers looked reasonable. The restatement took four months and cost more in accounting fees than the company had budgeted for the entire compliance project.
This is not an unusual outcome. ASC 842 has been effective for public companies since 2019 and for private companies since 2022, but real estate portfolios present specific challenges that standard lease accounting templates do not handle well. Ground leases, percentage rent clauses, stepped escalations, and CAM structures all affect the liability calculation in ways that require careful interpretation rather than standard data entry.
Real estate CFOs managing ASC 842 real estate leases across large commercial portfolios are responsible for getting this right. This post covers what ASC 842 real estate leases require, where the complexity lives, and what a compliant process looks like in practice.
What Is ASC 842 and Why Does It Matter for Real Estate?
ASC 842 is the lease accounting standard issued by the Financial Accounting Standards Board (FASB) that requires companies to recognize most leases on the balance sheet. Under the previous standard, operating leases were kept off the balance sheet entirely. Under ASC 842, they appear as both a right-of-use asset and a corresponding lease liability.
For real estate companies, this matters in two ways. First, as tenants, any office space, equipment, or land held under an operating lease must now appear on the balance sheet. Second, as landlords or operators managing leases on behalf of owners, the accounting treatment of each lease affects how financial statements are read by lenders, investors, and auditors.
The standard became effective for public companies in fiscal years beginning after December 15, 2018, and for private companies in fiscal years beginning after December 15, 2021. Most real estate portfolios are now well past the adoption deadline, but ongoing compliance, particularly around lease modifications and renewals, remains a common source of accounting errors.
How Does ASC 842 Apply to Commercial Real Estate Leases?
ASC 842 applies differently depending on whether a real estate company is acting as a lessee or a lessor, and the treatment varies significantly between the two roles.
As a Lessee
Any lease of land, buildings, or equipment with a term longer than twelve months must be assessed under ASC 842. Operating leases, which represent the majority of commercial real estate arrangements, generate a right-of-use asset and a lease liability on the balance sheet. Finance leases generate a right-of-use asset that is amortized separately from the lease liability interest.
As a Lessor
Lessor accounting under ASC 842 is largely unchanged from the previous standard. Operating leases are recognized on a straight-line basis over the lease term. Sales-type and direct financing leases follow a different treatment that most commercial real estate operators do not encounter frequently.
Understanding how lease terms translate into specific financial entries is the foundation of ASC 842 compliance. The difference between how net effective rent and face rent are calculated, for example, affects what gets recognized in the liability calculation. The breakdown of net effective rent versus face rent covers exactly how this plays out in commercial lease structures and where the numbers can diverge from what the lease document appears to say.
What Are the ASC 842 Requirements for Real Estate Companies?
The ASC 842 requirements that affect real estate companies most directly fall into four categories. Understanding how each one applies to ASC 842 real estate leases is the starting point for building a compliant process.
1. Lease Identification
Every contract that conveys the right to control an identified asset for a period of time in exchange for consideration must be assessed under ASC 842. In real estate, this means ground leases, building leases, parking arrangements, and certain equipment leases. The identification step is where most errors start because teams apply the old standard’s judgment rather than ASC 842’s specific criteria.
2. Lease Classification
Once a lease is identified, it must be classified as either an operating lease or a finance lease. The classification test involves five criteria relating to ownership transfer, purchase options, lease term, present value of payments, and asset specialization. Most commercial real estate operating leases are classified as operating leases, but ground leases and long-term land arrangements can meet the finance lease criteria.
3. Initial Measurement
At lease commencement, the lessee must calculate the present value of all future lease payments using the implicit rate in the lease or the incremental borrowing rate. This produces the initial lease liability. The right-of-use asset is then calculated as the lease liability plus initial direct costs plus prepaid lease payments, minus lease incentives received.
For guidance on the incremental borrowing rate calculation and how discount rate selection affects these numbers, the post on discount rate selection in real estate DCF models covers the underlying principles that apply to ASC 842 present value calculations as well.
4. Subsequent Measurement
After initial recognition, the lease liability is reduced by lease payments and increased by interest accretion each period. The right-of-use asset is amortized on a straight-line basis for operating leases. Any lease modification, including a change in lease term, payment amount, or scope, requires reassessment and remeasurement of both the asset and the liability.
This is where commercial real estate creates real complexity. A portfolio with rent escalation clauses, free-rent periods, tenant improvement allowances, and CAM structures requires ongoing recalculation, not a one-time setup.
What Makes Real Estate Lease Classification So Difficult?
Standard ASC 842 guidance assumes relatively simple lease structures, but ASC 842 real estate leases in commercial portfolios are rarely simple.
1. Escalation Clauses
Stepped rent increases and CPI-linked escalations affect the total lease payments used in the present value calculation. Under ASC 842, fixed escalations are included in the liability calculation while variable CPI-linked increases are excluded until they take effect. Getting this distinction right requires reading the lease carefully, not applying a standard formula.
2. Free-Rent Periods
Free-rent periods at lease commencement are common in commercial real estate as a tenant incentive. Under ASC 842, the right-of-use asset and lease liability are still calculated based on total payments over the full lease term. The straight-line rent expense smooths the free-rent period across the entire term, which means the income statement looks different from the cash flow statement during the free-rent period.
3. Tenant Improvement Allowances
TI allowances paid by the landlord to the tenant affect the lease liability calculation on the lessee side. Under ASC 842, landlord TI allowances are treated as lease incentives that reduce the right-of-use asset at commencement. Tracking these correctly requires connecting lease terms to the accounting entries, not treating them as separate transactions.
For real estate portfolios where TI allowances and escalation schedules are part of every lease, having lease and rental management built into the accounting platform means these items live in the same record as the ASC 842 entries rather than in separate tracking files that need manual reconciliation at period end.
4. CAM Structures
Common area maintenance (CAM) charges are variable lease payments under ASC 842. Their actual amount depends on operating expense actuals. They are excluded from the lease liability calculation. However, CAM estimates used for lease billing should be tracked separately from ASC 842 entries. This prevents double-counting in the financial statements.
For commercial portfolios, CAM accounting requires separate treatment for variable and fixed payments. Keep variable CAM charges separate from fixed lease payments in the general ledger.
What Does ASC 842 Compliance Look Like for a Commercial Portfolio?
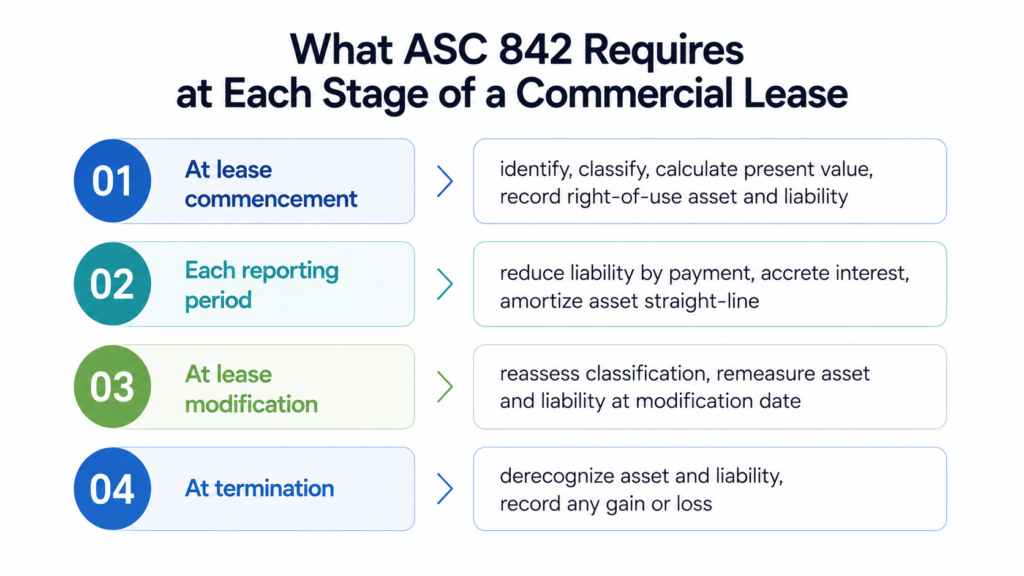
A compliant ASC 842 process for a mid-size commercial real estate portfolio involves several interconnected steps that must work consistently across every lease event.
1. At Lease Commencement
When a new lease begins, the finance team must identify and classify the lease. They must calculate the present value of future payments using the appropriate discount rate. They also record the initial right-of-use asset and lease liability. Finally, they document the assumptions and calculation inputs.
For a portfolio with hundreds of active leases, this process needs to be systematic rather than manual. Affordable housing operators and community associations, who face both ASC 842 and additional regulatory requirements, benefit particularly from having compliance-grade lease accounting built into the platform rather than managed in separate spreadsheets.
2. At Each Reporting Period
Every month, the lease liability must be reduced by the payment amount and increased by interest accretion at the discount rate used at commencement. The right-of-use asset is amortized on a straight-line basis. The journal entries for each lease must post to the general ledger accurately and consistently.
3. At Each Lease Event
Any modification to the lease terms, including a change in rent, a lease extension, an early termination, or a change in scope, requires the finance team to reassess the lease classification and remeasure the right-of-use asset and lease liability as of the modification date.
This is where manual processes break down. A portfolio with active lease management, where renewals and amendments are regular occurrences, generates modification events continuously. Tracking each one accurately in a spreadsheet creates accumulating risk that eventually surfaces during an audit.
How Do Real Estate Companies Implement ASC 842 at Scale?
For real estate companies managing dozens or hundreds of ASC 842 real estate leases, the implementation question is less about understanding the standard and more about building a process that handles ongoing compliance without requiring constant manual intervention.
What a Scalable Process Requires
- A single lease record that connects the legal terms to the accounting entries
- Automatic recalculation and journal entry posting when lease events occur
- A discount rate library that maintains the rate used at commencement for each lease
- An audit trail that traces every entry back to the lease event that triggered it
- Consolidated reporting that shows ASC 842 balances by property, entity, and portfolio
Where Most Real Estate Companies Struggle
The most common failure in ASC 842 implementation at scale is not the initial adoption but the ongoing maintenance. Teams adopt the standard, calculate the initial entries, and then manage subsequent events in the same spreadsheets they used before. Different team members record lease modifications in different ways. They also apply different discount rates between lease events. As a result, the right-of-use asset balance can drift from the spreadsheet because someone used a different calculation method.
Propertese is built on NetSuite’s financial infrastructure, which means ASC 842 entries post directly to the general ledger when a lease event occurs. Seeing how the financial backbone handles lease accounting makes the difference between a one-time setup and an ongoing compliance process clearer than any description can.
Frequently Asked Questions
What is ASC 842 in simple terms?
ASC 842 is an accounting rule that requires companies to put most leases on their balance sheet. Before this rule, operating leases were kept off the balance sheet. Now they appear as an asset and a matching liability.
Does ASC 842 apply to real estate companies?
Yes, on both sides. As tenants, real estate companies must recognize any lease longer than twelve months on the balance sheet. As landlords, the way they account for leases they grant to tenants changes depending on the lease type.
What is a right-of-use asset in real estate?
A right-of-use asset is the balance sheet entry that represents a company’s right to use a leased property for the duration of the lease. It is calculated as the present value of future lease payments, adjusted for initial direct costs and lease incentives.
How does ASC 842 handle CAM charges?
ASC 842 treats CAM charges as variable lease payments because the actual amount varies. The standard excludes them from the lease liability calculation. However, include fixed CAM estimates when the lease states them as fixed amounts.
How does ASC 842 treat a lease modification?
A lease modification requires reassessment of the lease classification and remeasurement of both the right-of-use asset and the lease liability as of the modification date. The new calculation uses the facts and circumstances at the modification date, including the discount rate in effect at that time.
How does ASC 842 differ from IFRS 16?
Both standards require operating leases on the balance sheet, but IFRS 16 treats all leases as finance leases on the income statement while ASC 842 maintains a distinction between operating and finance leases. For US-based real estate companies, ASC 842 applies. For international operations, IFRS 16 may apply instead.
ASC 842 Is an Ongoing Commitment, Not a One-Time Project
The initial adoption of ASC 842 is the start, not the finish. Every lease event, modification, renewal, and termination requires the same careful calculation that the first entry required. For real estate portfolios where lease events happen regularly, that means ASC 842 compliance needs to be built into the daily workflow rather than handled as a periodic project.
If the current process relies on spreadsheets to track those events and calculate the entries manually, the compliance risk grows with every lease that changes.
Talk to Propertese about what ASC 842 compliance looks like when lease accounting is part of the platform rather than a separate process running alongside it.