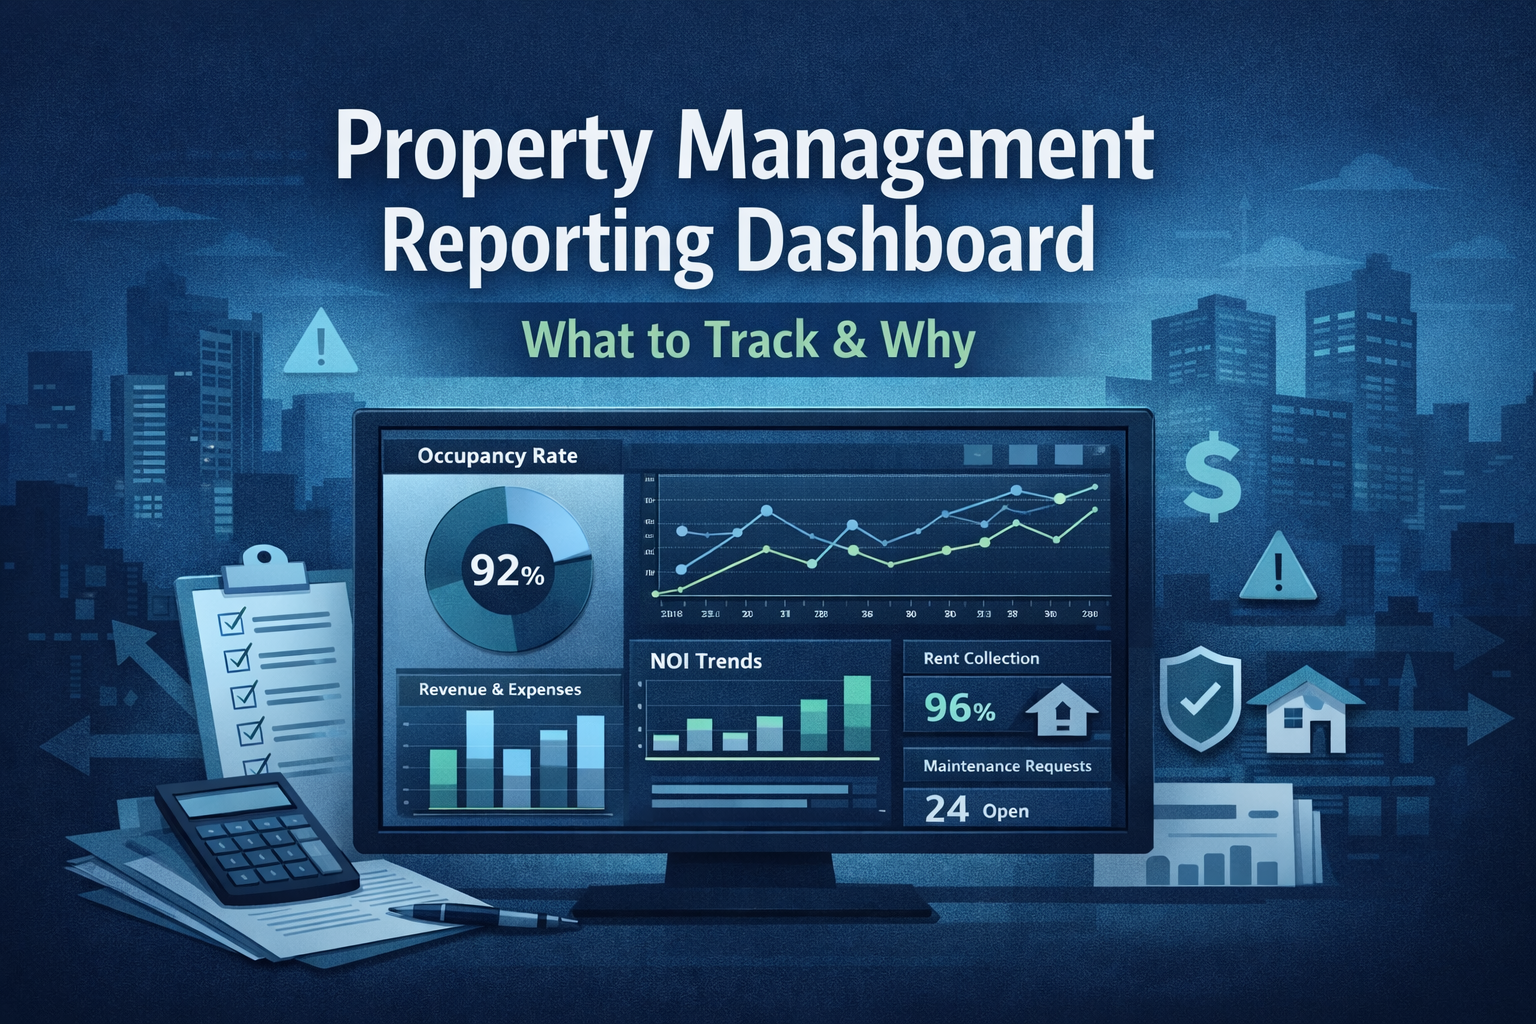
Most property leaders don’t struggle with a lack of data; they struggle with signal overload. A property management reporting dashboard should help decision-makers answer a few critical questions quickly: What’s performing well? What’s slipping? And what needs attention before it becomes expensive? When dashboards fail, it’s usually because they report activity instead of insight.
This guide explains what a modern property management reporting dashboard should track, why those metrics matter to business leaders, and how to structure dashboards that drive action.
Key Takeaways
- What business leaders actually expect from a property management reporting dashboard
- Financial, operational, tenant, and risk metrics that drive decisions
- KPIs competitors track—but often fail to contextualize
- How to structure role-based dashboards for executives vs. operators
- Common reporting mistakes that quietly undermine performance
- How reporting connects maintenance, compliance, and emergency readiness
What Is a Property Management Reporting Dashboard Meant to Solve?
At its core, a reporting dashboard exists to reduce uncertainty.
Executives don’t open dashboards to admire charts. They open them to:
- Validate whether the strategy is working
- Spot early signs of operational breakdown
- Decide where to allocate time, capital, and attention
Dashboards fail when they try to be comprehensive instead of decisive. The best dashboards are intentionally incomplete—they surface what matters now.
A well-designed property management reporting dashboard:
- Compresses complex operations into clear patterns
- Highlights deviations, not averages
- Encourages timely intervention
Which Financial Metrics Matter Most to Business Leaders?
Financial KPIs anchor every dashboard—but volume alone doesn’t create insight.
Revenue Quality, Not Just Revenue Volume
Most dashboards show total rent billed. Stronger dashboards show:
- Gross potential rent vs. collected rent
- Rent collection rate trends
- Delinquency aging by property or region
Tracking change over time is more valuable than static totals.
Expense Behavior Signals Operational Discipline
Expense reporting becomes actionable when it’s broken down by behavior, not category:
- Maintenance cost per unit
- Emergency vs. planned maintenance spend
- Vendor cost volatility
These insights gain meaning when tied to maintenance systems and workflows, as outlined in this property maintenance management systems guide.
Net Operating Income as a Diagnostic Tool
NOI shouldn’t just be reported—it should be interrogated.
Dashboards should allow leaders to:
- Compare NOI across similar asset classes
- Identify margin erosion drivers
- Spot properties masking issues behind strong revenue
NOI trends often reveal operational weaknesses faster than occupancy metrics alone.
Which Operational KPIs Indicate Portfolio Health?
Operational KPIs translate frontline activity into executive foresight.
Maintenance Responsiveness as a Leading Indicator
High-performing dashboards track:
- Average work order completion time
- Percentage of on-time resolutions
- Recurring issue frequency
Repeated maintenance issues often signal deeper asset or vendor problems. When paired with preparedness planning—like a property management emergency response plan—these metrics support proactive risk control.
Staffing and Scale Efficiency
Competitor dashboards increasingly emphasize efficiency ratios:
- Units per property manager
- Cost per unit managed
- Response volume per staff member
These KPIs help leaders understand whether growth is scalable—or simply stretching teams thinner.
How Should Occupancy and Leasing Metrics Be Interpreted?
Occupancy is easy to measure—and easy to misread.
Economic vs. Physical Occupancy
Dashboards should distinguish:
- Physical occupancy (units filled)
- Economic occupancy (revenue realized)
This distinction highlights concessions, under-market rents, and collection risk that headline occupancy rates hide.
Lease Stability and Revenue Predictability
Advanced dashboards include:
- Renewal rate trends
- Early termination frequency
- Average lease length by property
Data Never Lies emphasizes that lease behavior is often a stronger predictor of future cash flow than rent pricing alone.
Where Do Tenant Experience Metrics Belong?
Tenant experience is a revenue signal.
Experience Metrics That Actually Matter
Instead of generic satisfaction scores, dashboards should track:
- Maintenance response satisfaction
- Complaint recurrence rates
- Resolution follow-up success
These indicators correlate directly with renewals, referrals, and reduced vacancy churn.
How Should Risk, Compliance, and Safety Be Reported?
Risk becomes expensive when it’s invisible.
Compliance Visibility for Leadership
Dashboards should surface:
- Open compliance items
- Inspection outcomes
- Safety checklist completion rates
Aligning reporting with structured compliance processes—such as those in this OSHA inspection checklist for property managers—supports accountability across teams.
Incident and Emergency Tracking
Executives benefit from aggregated views of:
- Incident frequency
- Resolution timelines
- Cost impact per event
These metrics help quantify operational resilience, not just reaction speed.
What Benchmarks Are Missing from Most Dashboards?
One of the most common gaps across competitor dashboards is context.
Internal Benchmarks Drive Better Decisions
Dashboards should answer:
- How does this property compare to similar assets internally?
- Is performance improving or declining relative to baseline?
Internal benchmarks reduce reliance on imperfect market comparisons.
External Benchmarks as Reference Points
Used carefully, dashboards may include:
- Regional vacancy ranges
- Market rent growth indicators
Competitors agree these benchmarks guide questions—not conclusions.
How Should a Dashboard Be Structured for Different Roles?
One dashboard rarely serves everyone well.
Executive Dashboards
Executives need:
- Fewer KPIs
- Clear trends
- Exception alerts
Operational Dashboards
Operations teams need:
- Task-level visibility
- Daily performance indicators
- Workflow bottleneck signals
Separating these views increases adoption and accountability.
What KPIs Belong on an Executive Dashboard?
| Category | KPI | Decision Value |
|---|---|---|
| Financial | NOI by Property | Profitability insight |
| Financial | Rent Collection Rate | Cash flow stability |
| Operations | Avg. Work Order Time | Service quality |
| Operations | Cost per Unit | Scalability |
| Occupancy | Renewal Rate | Revenue predictability |
| Risk | Open Compliance Issues | Exposure awareness |
What Reporting Mistakes Undermine Dashboard Value?
An in-depth analysis reveals recurring issues:
- Too many KPIs competing for attention
- Mixing strategic and tactical metrics
- Reporting without historical context
- Treating dashboards as static monthly reports
Dashboards should evolve with portfolio complexity.
How Does Reporting Support Long-Term Property Management Strategy?
Reporting shapes behavior.
When dashboards align financial, operational, and risk data, leaders:
- Allocate capital more confidently
- Intervene earlier
- Scale portfolios with fewer surprises
This is where reporting becomes a strategic asset within broader property management operations.
Frequently Asked Questions
What is the most important KPI to track?
NOI remains the core KPI, but it’s most effective when paired with rent collection and operating cost trends.
How often should dashboards be reviewed?
Executives typically review dashboards weekly, while operations teams rely on daily views.
Can one dashboard work for all stakeholders?
No. Role-based dashboards consistently outperform single-view designs.
How many KPIs should an executive dashboard include?
Most effective dashboards limit core KPIs to 8–12 to maintain clarity.
Conclusion
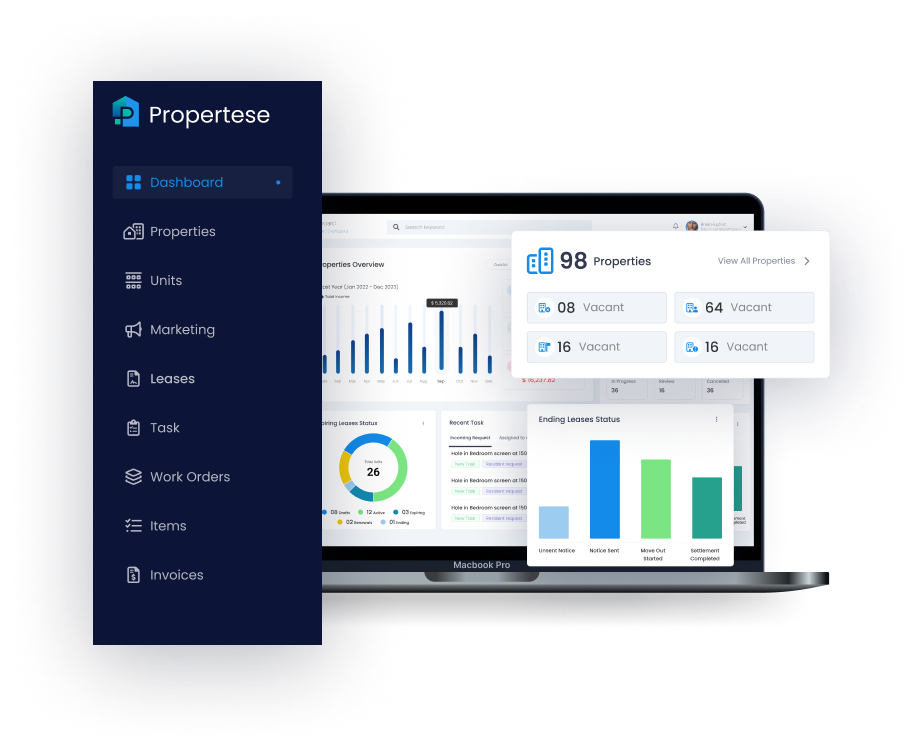
A property management reporting dashboard like Propertese should simplify decision-making, not complicate it. When dashboards focus on trends, exceptions, and business-critical KPIs, leaders gain clarity instead of noise.
If your current reporting feels busy but unhelpful, the opportunity isn’t more data—it’s better structure. Reframing dashboards around decision value is often the fastest way to improve performance across modern property management portfolios.
Table of Contents
Stay Updated
Subscribe to get the latest news, industry trends, blog posts, and updates...