Property maintenance costs now consume 1–3% of a property’s value every year, $5,000–$15,000 for a $500K asset. Yet, in 2025, industry leaders leverage data-driven maintenance, not guesswork. Ignoring the right metrics can result in 20–40% higher costs, 50% more tenant turnover, and a decline in your property’s value. Metrics are no longer optional; they are your shield against shrinking margins and dissatisfied tenants.
The Business Value of Maintenance Metrics
- Predictive maintenance yields up to 10x ROI and reduces annual costs by 25–30%.
- Properties with data-driven service achieve longer tenant stays and higher rents.
- Documented, systematic maintenance reduces insurance premiums up to 20%.
- Outperforming benchmarks cements your reputation and attracts owners and residents.
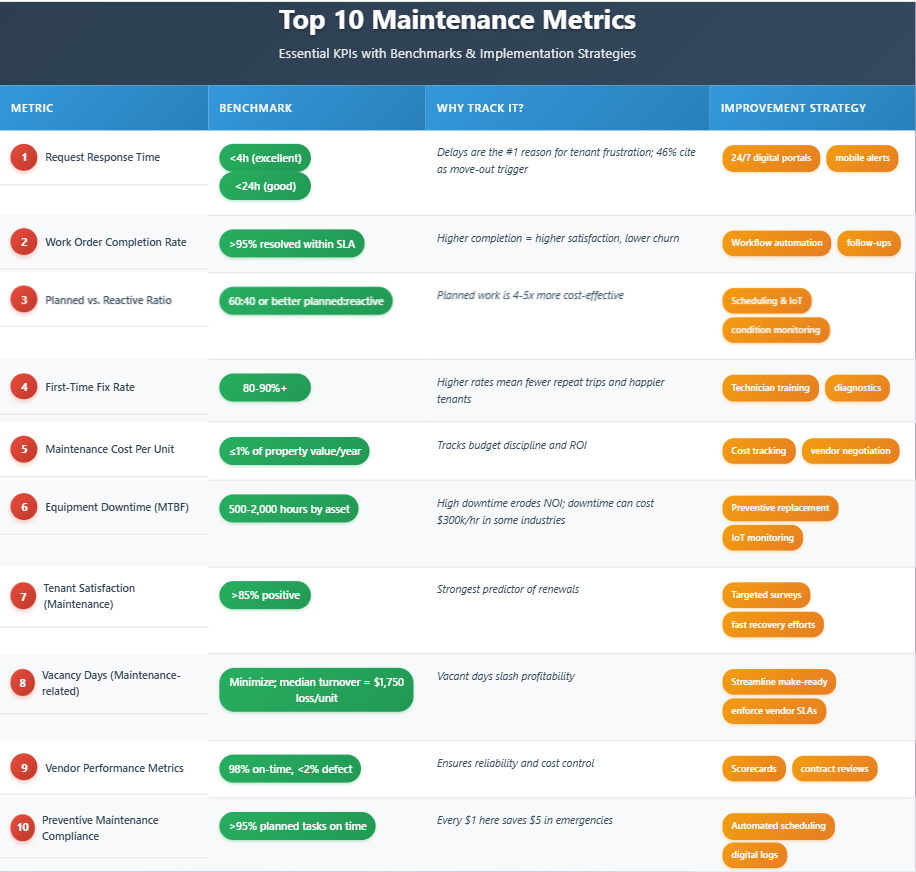
The Top 10 Maintenance Metrics (with Benchmarks & How-To)
Metric Insights & Action Steps
1. Request Response Time
- What: Time from tenant request to acknowledgement.
- Why: Builds trust, curbs tenant frustration.
- Action: Enable instant online request logs, SMS/email confirmations, and auto-routing.
Learn about tenant communication tech:
Smart Solutions for Efficient Tenant Communication
2. Work Order Completion Rate
- What: % of maintenance jobs completed within service time goals.
- Why: Missed targets fuel backlog and dissatisfaction.
- Action: Integrate automated workflows and mobile apps to eliminate manual bottlenecks.
3. Planned vs. Reactive Maintenance Ratio
- What: Share of scheduled vs. last-minute repairs.
- Why: High planned rates boost profitability; reactive = expensive.
- Action: Schedule recurring checks, use sensor data for alerts, analyze your ratio each quarter.
See more: Benefits of Automation in Property Management
4. First-Time Fix Rate
- What: % of jobs resolved at first visit.
- Why: High rates save time, build tenant trust, and save money.
- Action: Utilizing tech checklists, inventory-on-hand, and AR-based troubleshooting can improve this metric.
5. Maintenance Cost Per Unit
- What: Total annual maintenance ÷ number of units.
- Why: Reveals efficiency, possible overspending, or neglect.
- Action: Track all costs per category, leverage bulk purchases, and use detailed reporting software.
6. Equipment Downtime (MTBF)
- What: Hours of equipment operation between failures.
- Why: Longer = better reliability; short intervals signal looming costs.
- Action: Monitor with IoT, schedule replacements, target root causes of frequent failures.
7. Tenant Satisfaction with Maintenance
- What: Feedback after each job, overall satisfaction rate.
- Why: Directly drives renewals, reviews, and referrals.
- Action: Automate surveys, incentivize 5-star service, analyze complaints weekly.
How to survey tenants: Tenant Satisfaction Survey Guide
8. Maintenance-Related Vacancy Days
- What: The Days a unit sits empty due to repairs.
- Why: Each day vacant is lost revenue.
- Action: Parallelize vendor work, pre-order key parts, review move-out processes.
Checklist here: The Ultimate Move-Out Procedures Checklist
9. Vendor Performance Metrics
- What: On-time, on-budget delivery rate; % work needing re-dos.
- Why: Bad vendors drive delays and costs.
- Action: Use scorecards, require digital status updates, review performance quarterly.
10. Preventive Maintenance Compliance
- What: % of planned preventive work completed on time.
- Why: High rates mean lower emergencies—each $1 here saves $5 in crisis repairs.
- Action: Automate schedules and attach compliance logs to each asset.
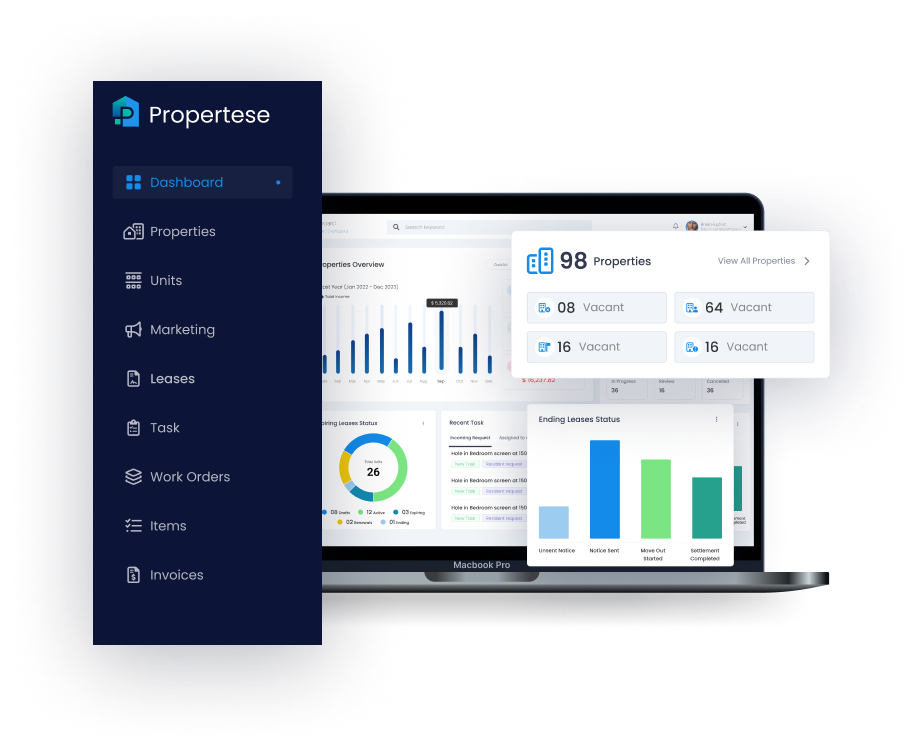
Why Propertese Is the Metric-Driven Property Management Platform
The modern manager needs to act, not just react. Propertese was built for the future of property performance, giving you the real-time insights, automations, and analytics you need to stay ahead.
How Propertese Supercharges Your Maintenance Operations:
- All-in-One KPI Dashboard: Track every maintenance metric (response times, costs, compliance, and more) from a unified, customizable dashboard.
See: Optimize Support and Maintenance Request Management - Automated Workflow Engine: Instantly route requests, set preventive schedules, and eliminate missed or delayed work orders with built-in reminders.
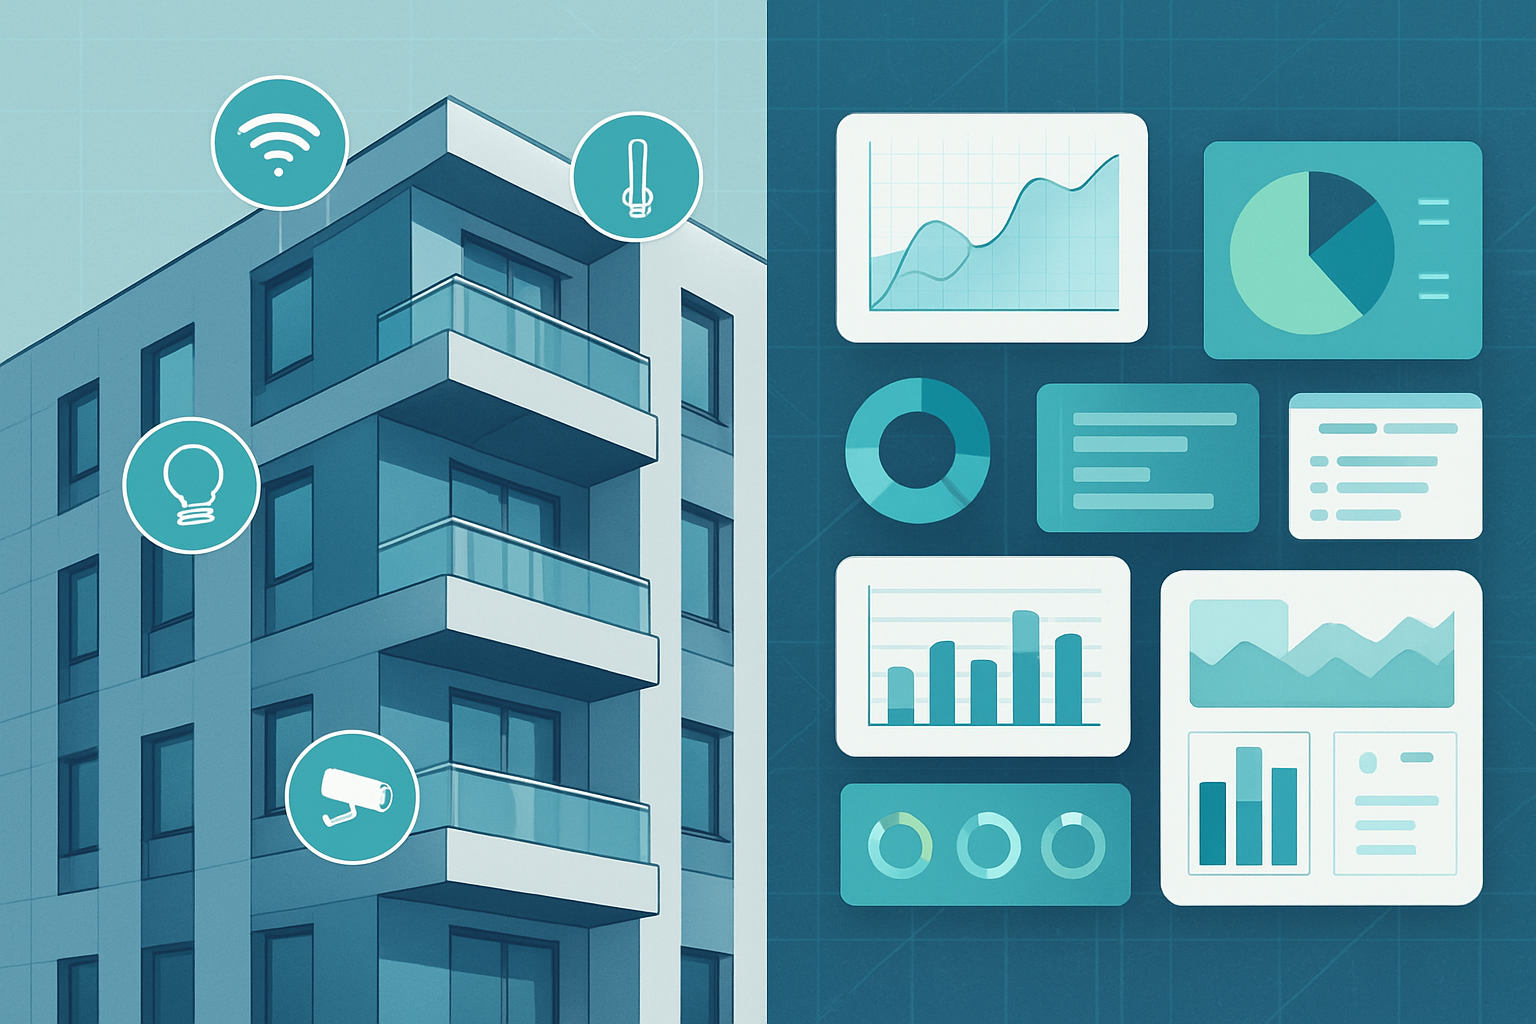
- Smart Scheduling & IoT Integration: Connects seamlessly with sensors and building automation for real-time alerts and predictive maintenance.
See how AI and data power smarter management: How Generative AI Is Helpful for Property Management Software - Vendor & Team Management: Score vendors, automate benchmarking, and empower your team with role-based mobile access to every work order.
- Tenant-Focused Feedback Loops: Launch maintenance satisfaction surveys post-service, spot trends, and proactively resolve issues before they cost you.
Results property managers achieve with Propertese:
- 29% reduction in annual maintenance costs
- 18% faster average response times
- 17% higher tenant satisfaction scores
Next Steps: Turn Insights into Action, and Action into Results
- Start with three KPIs: request response time, completion rate, and maintenance cost per unit.
- Audit your workflows—are you using automation and analytics to their full potential?
- Benchmark against industry leaders quarterly.
- Want to trial our Property Maintenance Metrics Tracker? Book a free product tour today or watch our quick video reel to see how it transforms your maintenance operations in real time.