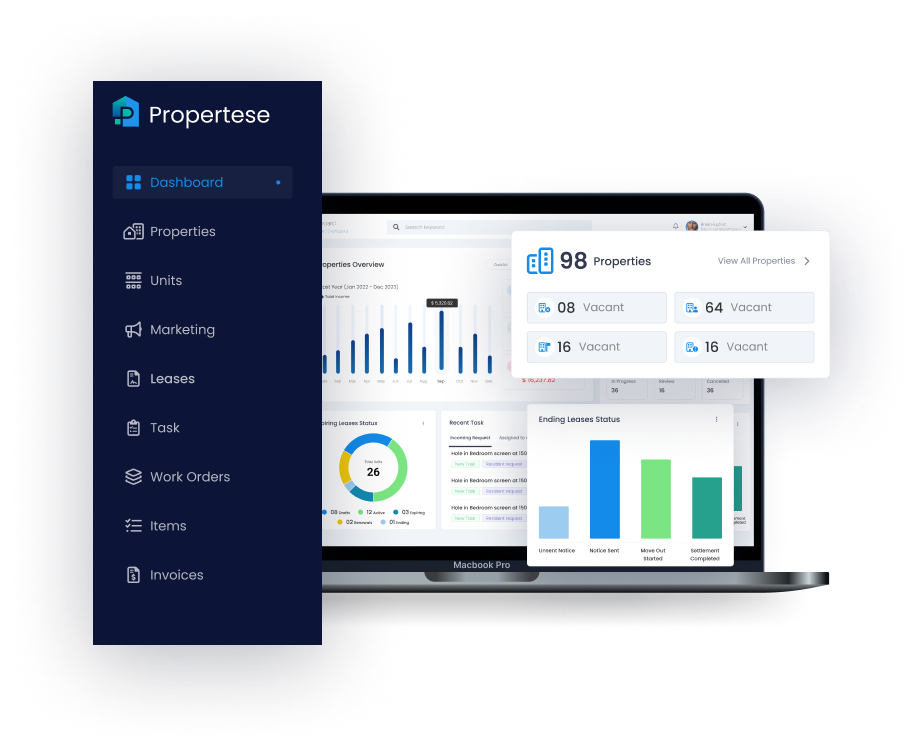
Absorption rate in real estate markets measures how quickly properties are sold or leased within a defined area and time frame. By showing the pace at which available inventory is “absorbed” by demand, it helps professionals read market balance, anticipate pricing pressure, and plan leasing and sales strategies. In residential markets, the rate is typically expressed as a percentage of units sold per month; in commercial markets, it’s often tracked in square feet absorbed per period. For property managers and portfolio leaders, absorption rate is a fast market pulse that supports pricing strategy, staffing, and inventory planning across assets. At Propertese, we translate market absorption into real-time portfolio views, enabling teams to act sooner—whether to accelerate marketing in soft conditions or capture gains when the market tightens.
Definition of absorption rate
Absorption rate is the speed at which available properties sell or lease in a market over a set period, typically shown as a percentage of active listings (residential) or as square feet absorbed (commercial). It’s a leading indicator of demand strength and supply-demand balance, giving teams a practical “how fast?” signal for market health. A clear baseline definition is provided by Investopedia, which frames absorption as the rate at which homes are sold in a specific area over time, used by agents, appraisers, and investors to assess conditions and pricing power (see Investopedia definition).
How to calculate absorption rate
The standard calculation answers a simple question: “What share of current inventory did the market absorb this period?”
- Core formula: Absorption Rate = (Number of homes sold ÷ Number of available homes) × 100. A concise walkthrough appears in the Zillow guide.
- Alternative view—months of inventory: Months of Inventory = Active listings ÷ Average homes sold per month. This flips the lens to “how many months to sell current supply?” as described in the Redfin definition.
Worked example:
- If 1,000 homes are on the market and 250 sell this month, the absorption rate is 25%. Interpreted as months of inventory, 1,000 ÷ 250 = 4 months, a common conversion illustrated in the Rocket Mortgage explainer.
Best practices:
- Use closed sales and current active supply (not projected listings).
- Smooth noise by using rolling windows (e.g., 6 or 12 months), while still watching recent month-over-month shifts for turns in momentum.
Gross absorption versus net absorption
In commercial and institutional portfolios, it’s critical to distinguish gross versus net absorption:
- Gross absorption: Total space or units leased/sold in a period—ignores move-outs or vacancies.
- Net absorption: Leased/sold space minus vacated space—captures the true change in occupied space.
Commercial reports often express absorption in square feet per period, a convention detailed by the Corporate Finance Institute on absorption.
| Metric | Definition | Core formula | Typical unit | What it shows | Common uses |
|---|---|---|---|---|---|
| Gross absorption | Total space or units taken up in a period | Sum of all new leases/sales | SF or units per month/quarter | Demand volume | Leasing velocity, marketing intensity |
| Net absorption | Net change in occupied space | Gross absorption − Space vacated | SF per month/quarter | True occupancy change | Portfolio performance, supply-demand balance, underwriting |
Analysts favor net absorption to judge overall demand and trajectory of occupancy, while gross absorption helps gauge leasing velocity and marketing effectiveness.
Interpreting absorption rate thresholds
Market participants use simple thresholds to translate absorption into conditions and likely outcomes:
- High absorption (≈20% or higher) often signals a seller’s market with faster sales and upward price pressure.
- Low absorption (below ≈15%) points to a buyer’s market with longer marketing times and potential price cuts.
- Balanced conditions typically fall between ~15% and 20%.
- In months-of-inventory terms, the National Association of Realtors convention is: under 6 months = seller’s market; 6+ months = buyer’s market, widely echoed in the Chase overview on absorption.
| Indicator | Threshold | Market condition | Implications |
|---|---|---|---|
| Absorption rate | ≥ 20% | Seller’s market | Fast sales, fewer concessions, pricing leverage, possible bidding wars |
| Absorption rate | 15%–20% | Balanced | Steady sales, moderate marketing times, stable pricing |
| Absorption rate | < 15% | Buyer’s market | Longer days on market, more concessions, price reductions |
| Months of inventory | < 6 months | Seller’s market | Tight supply, rising prices likely |
| Months of inventory | ≥ 6 months | Buyer’s market | Ample supply, flat/declining prices likely |
Applications of absorption rate for market participants
- Sellers and listing agents: Set pricing strategy and adjust marketing intensity to match market velocity; escalate exposure when absorption softens.
- Buyers: Identify negotiation power in low-absorption periods; move decisively in high-absorption submarkets.
- Property managers: Calibrate leasing cadence, staffing, renewal strategies, and concessions by submarket and asset type with the insights provided by Propertese.
- Investors: Time entries/exits, underwrite rent growth assumptions, and benchmark market absorption against portfolio targets.
- Developers: Test development feasibility, phasing, and pre-leasing thresholds against expected absorption.
- Lenders and appraisers: Evaluate collateral risk, stabilize value estimates, and stress-test lease-up timelines.
Propertese integrates market absorption, months of inventory, and leasing metrics to surface real-time opportunities and risks across diverse portfolios.
Limitations and considerations in using absorption rate
- Backward-looking: It’s derived from historical closes and can lag turns; it won’t foresee shocks or policy changes, as noted in the Privy primer on limitations.
- Timeframe sensitivity: Short windows can be noisy; long windows can mask inflection points.
- Market segmentation: Asset class, price band, and submarket variations can distort blended rates.
- Inventory basis: It reflects actual, current inventory—future listings or shadow supply aren’t counted.
- Seasonality and data quality: Holidays, school calendars, and reporting lags can skew readings.
Best practice: Pair absorption with vacancy rates, median price trends, rent growth, days on market, and macro signals (employment, rates) to triangulate true conditions.
Emerging trends in absorption rate analysis
- High-frequency signals: Daily listing flows, lead volumes, and tour data refine “dynamic absorption” beyond monthly closings, as explored in the Sparkco deep dive.
- Predictive modeling: Machine learning blends absorption with pricing, vacancy, and macro inputs to forecast lease-up and turnover scenarios.
- Digital twins and scenario testing: Portfolio-level simulations expose sensitivity to supply shocks, rate moves, or policy changes.
- Transparency and auditability: Ledger-backed leasing data and standardized reporting are improving trust in submarket reads.
- Operational integration: Platforms like Propertese turn market absorption into live dashboards and alerts that trigger coordinated leasing and pricing actions.
Frequently asked questions
How does absorption rate differ from vacancy rate?
Vacancy rate measures the share of unoccupied space at a specific point in time; absorption rate tracks the speed at which market demand is filling that space over a period.
What does a high absorption rate indicate for sellers and buyers?
It signals strong demand and faster sales, giving sellers pricing leverage while buyers face more competition and tighter timelines.
Why is absorption rate important for real estate investors and developers?
It helps gauge demand strength, calibrate investment timing, and assess the feasibility and phasing of new projects.
How should absorption rate be combined with other market indicators?
Pair it with vacancy, pricing and rent trends, days on market, and macro data to validate signals and reduce false readings.
What factors can affect absorption rate accuracy and interpretation?
Time window, asset type, price tier, submarket scale, seasonality, and data quality all influence how reliable and comparable the metric is.
Table of Contents
Stay Updated
Subscribe to get the latest news, industry trends, blog posts, and updates...