A well-structured Property Management KPI Dashboard gives managers, owners, and investors a single view of performance across their entire portfolio. From rent collection to maintenance efficiency and market ROI, these dashboards turn raw data into actionable insights. This article explains what a Property Management KPI Dashboard is, lists the most critical metrics every manager should monitor, and shows how platforms like Propertese make it simple to track, automate, and improve performance.
Key takeaways:
- A Property Management KPI Dashboard unites finance, operations, tenant, growth, and ESG data in real time
- Start with a small set of core KPIs, then expand as your data matures
- Use alerts and SLA to act fast on underperformance
- Compare assets side by side to see trends and risks
- Propertese enables automation, clear reports, and role-based control
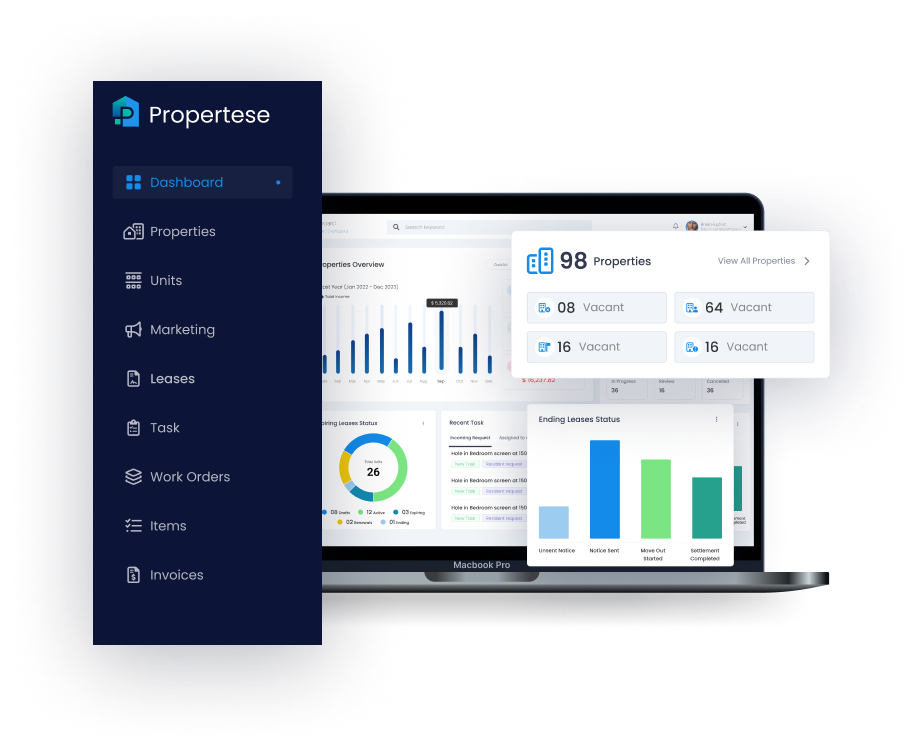
Property management KPI dashboard
A Property Management KPI Dashboard is a centralized platform that displays essential performance indicators such as occupancy, rent collection, and expenses in one unified interface. The goal is to provide real-time insight into financial health, operational efficiency, and tenant satisfaction across a property portfolio.
A robust dashboard groups KPIs into categories:
- Financial: revenue, expenses, cash flow, and NOI
- Operational: maintenance, lease, and compliance
- Tenant-focused: satisfaction, retention, and service quality
- Marketing: lead conversion, campaign ROI, and show to lease rates
Propertese enhances these capabilities with deep ERP integration, automated workflows, and customizable dashboards. Managers can access real-time reports, compare portfolios, and receive automated alerts, all within a role-based, single-view environment for precise oversight and control. See our property management report dashboard for layout and best practices.
Occupancy rate
Occupancy rate measures how effectively available units are leased and is a key indicator of revenue consistency.
Formula:
Occupancy rate = (Total units rented ÷ Total available units) × 100
A healthy portfolio typically maintains 95 to 96% occupancy in strong markets. Propertese shows occupancy trends by property type, region, or ownership group and flags underperforming areas or new demand patterns for fast action in your Property Management KPI Dashboard.
Tenant retention and renewal rate
Tenant retention and renewal rates measure portfolio stability and the efficiency of tenant relations.
Formulas:
Tenant retention rate = (Tenants who renewed ÷ Leases up for renewal) × 100
Renewal rate = (Renewed leases ÷ Total expiring leases) × 100
High retention reduces turnover costs related to vacancies and the market. Best performing portfolios aim for tenant churn below 10%, and Propertese dashboards make it easy to track renewal trends and automate follow-ups when churn rises. These views sit inside the Property Management KPI Dashboard for a clear read on stability.
Average days to lease
Average days to lease show how quickly units are filled once vacant.
Formula:
Average days to lease = Total days units were vacant ÷ Number of units leased
Efficient teams target fewer than 30 days. Consistent averages above 45 days indicate market or price issues. Within Propertese, this metric connects to automated lease SLAs and triggers alerts when thresholds are exceeded.6
Rent collection and delinquency rates
Rent collection rates reflect liquidity health, while delinquency measures potential risk.
Formulas:
Rent collection rate = (Rent collected on time ÷ Total rent due) × 100
Tenant delinquency rate = (Tenants behind on rent ÷ Total tenants) × 100
Strong portfolios maintain 97 to 99% collection consistency. Propertese charts these metrics over time and flags sudden shifts in dues or delinquency to support consistent cash flow management.
Net operating income and cash flow per unit
Profitability KPIs show both revenue and operational efficiency.
Formulas:
Net Operating Income (NOI) = Total revenue − Operating expenses
Cash flow per unit = Net cash flow ÷ Number of units
These metrics normalize profitability across properties, allowing owners to distinguish high ROI from underperforming assets. Propertese enables side-by-side NOI comparisons and trend maps to reveal performance drivers inside your Property Management KPI Dashboard.
Operating expense ratio and maintenance cost per unit
Expense-related KPIs measure operational control and cost efficiency.
Formulas:
Operating expense ratio = Total operating expenses ÷ Gross revenue
Maintenance cost per unit = Total maintenance expenses ÷ Number of units
Targets for operating expense ratios fall between 30% to 40%. Tracking maintenance cost per unit helps pinpoint inefficiencies or aging assets. Propertese dashboards surface high-cost properties and support quick corrective plans.
Maintenance KPIs: response time, first-time-fix rate, work order completion
Maintenance performance directly influences satisfaction and retention.
Formulas:
Average response time = Sum of response times ÷ Number of requests
First time fix rate = (Issues fixed on first visit ÷ Total work orders) × 100
Work order completion rate = (Completed work orders ÷ Total work orders) × 100
Top maintenance teams achieve first-time fix rates above 85%. Response goals often range from 1 to 2 hours for emergencies to 24 to 48 hours for routine tasks. Propertese enables tiered response and live status view to uphold service standards.
Marketing ROI and lead-to-show / show-to-lease rates
Market performance metrics link spend to lease outcomes.
Formulas:
Marketing ROI = (Revenue from channel − Cost of channel) ÷ Cost of channel
Lead to show rate = (Property showings ÷ Total leads) × 100
Know how leads move through the funnel to refine campaigns. Propertese combines ROI and conversion visuals so managers can shift budgets toward the most effective channels. For deeper lease metrics, see our lease KPIs for property managers.
Doors added vs doors lost and owner Net Promoter Score
Track business growth and client satisfaction to support long term stability.
Formulas:
Doors lost (churn) = (Doors lost ÷ Total doors) × 100
Owner Net Promoter Score (NPS): measures owner satisfaction based on the likelihood to recommend
Annual churn below 10% reflects strong owner retention. Propertese tracks doors added versus lost alongside NPS results and helps teams detect and address at-risk relationships early.
Technology adoption and report accuracy
Digital maturity affects both speed and reliability.
Metrics:
Automation adoption rate = (Automated processes ÷ Total processes) × 100
Report accuracy = (Error free reports ÷ Total reports) × 100
Propertese automates workflows across accounting, lease, and maintenance, and improves month-end close times and report precision, two key drivers of confident, data-backed decisions in a Property Management KPI Dashboard.
ESG and energy metrics
Sustainability-focused investors and tenants value ESG transparency. Key metrics include total energy consumption, carbon emissions per unit, and water usage. Add ESG dashboards to improve visibility into compliance initiatives and signal forward-thinking management. Propertese supports ESG data tracking for portfolios focused on environmental performance and reporting standards.
How to prioritize and use your KPI dashboard
Start simple and expand with clear intent. Begin with six to ten foundational KPIs: occupancy, NOI, rent collection, days to lease, maintenance response, and churn. Use automation to generate property-level and owner-level views and set clear alerts for underperformance in your Property Management KPI Dashboard.
As data maturity improves, refine KPIs to add depth without loss of stability. For a wider KPI list, see property management KPIs you should track.
| KPI Category | Core Metric Example | Review Frequency |
|---|---|---|
| Financial | NOI, Rent Collection | Monthly |
| Operational | Days to Lease, Maintenance | Monthly |
| Tenant | Retention, Renewal | Quarterly |
| Growth | Doors Added/Lost | Monthly |
| ESG | Energy & Water Use | Semi annual |
Benefits and challenges of a property management KPI dashboard
A well-designed Property Management KPI Dashboard delivers tangible benefits:
- Real-time insights for faster, data-driven decisions
- Transparent report for owners and investors
- Efficiency through automation and SLA alerts
Challenges often arise from weak data governance, inconsistent integrations, or track too many KPIs at once. The best approach is to set data accuracy first and expand only after financial and occupancy metrics are fully integrated. Propertese’s unified ERP and report structure helps ensure this foundation stays strong from the start.
Frequently asked questions
What are the essential KPIs every property manager should track?
Occupancy rate, tenant retention, NOI, rent collection, days to lease, expense ratio, and maintenance response times provide the clearest performance picture inside a Property Management KPI Dashboard.
Why do property managers need a centralized dashboard?
A centralized dashboard, such as Propertese, removes manual reports and enables real time comparisons across properties for faster decision making.
How should KPIs be reviewed and monitored?
Review financial and operational KPIs monthly, use visual alerts in Propertese to signal when thresholds require action.
What role does data visualization play in property management dashboards?
Clear visuals simplify KPI interpretation and communication. They reduce analysis time and improve response.
How can property managers connect marketing spend to actual leasing results?
Track cost per lead and conversion rates through each stage, lead, show, and lease. Propertese links market investments directly to lease performance inside your Property Management KPI Dashboard.
A clear Property Management KPI Dashboard turns data into confident action. If you want one source of truth for owners and teams, see how Propertese can help you unify KPIs, automate key workflows, and present results that build trust.
Table of Contents
Stay Updated
Subscribe to get the latest news, industry trends, blog posts, and updates...