What You’ll Learn in This Guide:
✓ The three core financial statements every property manager must understand (income statement, balance sheet, cash flow statement) and what each one tells you about your properties
✓ How to calculate and interpret key metrics like Net Operating Income (NOI), occupancy rates, and cash flow to make better investment and operational decisions
✓ Common red flags and mistakes property managers miss when reviewing financial reports that lead to cash shortages, trust account violations, and poor portfolio performance
A property owner calls asking why their monthly statement shows a loss when tenants paid rent on time. You look at the report and see numbers everywhere: rental income, operating expenses, NOI, cash flow, reserves. You’re not entirely sure which numbers matter most or how to explain the apparent loss when rent was collected.
This happens more often than property managers want to admit. Financial statements contain critical information about property performance, but they’re only useful if you know how to read them correctly.
Understanding property management financial statements is not optional knowledge. It’s the foundation of running a profitable operation, maintaining owner trust, staying compliant with trust account regulations, and identifying problems before they become crises.
The Three Core Financial Statements You Need to Know
Every complete property management financial statement package includes three reports that work together to tell your property’s complete financial story.
Income Statement (Profit & Loss Statement)
The income statement shows whether your property made or lost money during a specific time period. Think of it as your property’s financial report card covering a month, quarter, or year.
What it includes:
Revenue section lists all money your property earned including rental income, late fees, application fees, pet fees, parking income, and any other charges collected from tenants.
Expense section details every cost associated with running the property such as maintenance, repairs, property management fees, insurance, utilities, landscaping, snow removal, and administrative costs.
Net Operating Income (NOI) appears as the critical line item showing revenue minus operating expenses. This number tells you how much profit the property generated from operations before considering financing costs.
According to NetSuite’s real estate financial analysis, the income statement sheds light on how well you’re managing your business and individual properties, and whether you’re generating sufficient income to cover expenses and debts.
How to read it correctly:
Start at the top with total revenue. This shows your property’s income-generating capacity.
Move down through the expense categories. Look for any line items that seem unusually high compared to previous periods or your budget.
Focus on the Net Operating Income line. Positive NOI means your property is profitable from operations. Negative NOI means operating costs exceed income, which is unsustainable long-term.
Compare this period’s results to previous periods. Is NOI improving or declining? Are specific expenses growing faster than income?
Balance Sheet (Statement of Financial Position)
The balance sheet provides a snapshot of your property’s financial position at a specific point in time. Unlike the income statement which covers a period, the balance sheet answers “what do we own and owe right now?”
What it includes:
Assets represent everything the property owns or controls that has value. Cash in bank accounts, money owed to you from tenants (accounts receivable), security deposits held in trust, property and equipment.
Liabilities show what the property owes to others. Security deposits payable to tenants when they move out, unpaid bills to vendors, mortgage balances, accrued expenses.
Equity displays the owner’s stake in the property after subtracting liabilities from assets. This is the property’s net worth.
How to read it correctly:
Check that your security deposits held (asset) exactly match your security deposits payable (liability). If these don’t match, you have a trust accounting problem that needs immediate attention.
Review accounts receivable. High receivables might mean tenants are falling behind on rent, creating cash flow problems even if your income statement looks okay.
Look at accounts payable. Are bills piling up unpaid? This indicates cash flow stress.
Calculate your current ratio by dividing current assets by current liabilities. A ratio above 1.0 means you have enough liquid assets to cover short-term obligations.
Cash Flow Statement
The cash flow statement tracks actual cash moving in and out of your property during a specific period. This differs from the income statement because it focuses on when cash actually changes hands, not when income is earned or expenses are incurred.
What it includes:
Operating activities show cash from normal property operations like collecting rent and paying bills.
Investing activities display cash used for property improvements, equipment purchases, or property acquisitions.
Financing activities reflect cash from loans, mortgage payments, or owner contributions and distributions.
How to read it correctly:
Start with cash at the beginning of the period, then follow how each activity added or subtracted cash, ending with your current cash balance.
A property can show profit on the income statement but still run out of cash if timing mismatches exist between when income is earned and when expenses must be paid.
Negative cash flow from operations is a red flag even if NOI is positive. It means you’re not collecting money as fast as you’re paying bills.
Key Metrics Every Property Manager Must Track
Beyond the three core statements, specific metrics tell you whether your properties are performing well or heading toward problems.
Net Operating Income (NOI): Your Profitability Baseline
Net Operating Income measures how much money a property generates after paying operating expenses but before considering financing costs and taxes.
The NOI formula:
NOI = Gross Operating Income – Operating Expenses
Gross operating income includes all rental income plus other revenue streams like parking, laundry, pet fees, minus any vacancy losses.
Operating expenses include property taxes, insurance, maintenance, repairs, utilities, property management fees, landscaping, and administrative costs.
What NOT to include in NOI calculations:
Mortgage payments and interest (these are financing costs, not operating costs)
Capital expenditures like roof replacements or major renovations (these are one-time improvements, not ongoing operations)
Depreciation (this is an accounting concept, not actual cash expense)
Income taxes (these vary by owner’s tax situation, not property operations)
According to Wall Street Prep’s NOI analysis, NOI is the industry-standard measure of profitability because it isolates core operating performance from financing decisions and tax situations.
Why NOI matters more than any other single metric:
Property values in commercial real estate are directly tied to NOI. Higher NOI means higher property value.
Lenders evaluate your NOI when deciding loan amounts. Strong NOI indicates ability to service debt.
Investors compare properties using NOI because it removes the noise of different financing structures and tax situations.
Example NOI calculation:
A 20-unit apartment building collects $240,000 annually in rent. Other income (laundry, parking) adds $12,000. Total gross income is $252,000.
Operating expenses break down as follows:
- Property taxes: $24,000
- Insurance: $18,000
- Maintenance and repairs: $36,000
- Property management fees: $24,000
- Utilities: $15,000
- Landscaping: $6,000
- Administrative: $9,000
- Total operating expenses: $132,000
NOI = $252,000 – $132,000 = $120,000
This property generates $120,000 in operating profit annually before considering mortgage payments or capital improvements.
Occupancy Rate: Your Revenue Foundation
Occupancy rate measures what percentage of your units are currently rented and generating income.
The occupancy formula:
Occupancy Rate = (Occupied Units / Total Units) × 100
If you have 95 units and 90 are occupied, your occupancy rate is 94.7%.
Why this matters:
Every 1% drop in occupancy directly reduces your gross income and NOI. A property with 100 units at $1,200/month loses $14,400 annually for each 1% occupancy decline.
Occupancy below 90-92% typically indicates problems with property condition, pricing, marketing, or market oversupply.
High occupancy (98-100%) might actually indicate you’re undercharging for rent. Some vacancy is healthy because it means you’re pricing at market rate.
Track occupancy trends, not just current numbers:
Is occupancy improving or declining compared to last quarter?
How does your occupancy compare to similar properties in your market?
What’s causing turnover? Are tenants leaving for specific reasons you can fix?
Cash Flow: What Actually Hits Your Bank Account
Cash flow shows the actual money moving in and out of your property after all expenses, including mortgage payments and capital expenditures.
The cash flow formula:
Cash Flow = NOI – Debt Service – Capital Expenditures + Other Income
While NOI measures operating profitability, cash flow measures whether you’re actually generating excess cash or burning through reserves.
Positive vs. negative cash flow:
Positive cash flow means you’re generating more cash than you’re spending. This excess can build reserves, fund improvements, or distribute to owners.
Negative cash flow means you’re spending more than you’re bringing in. This drains reserves and eventually requires owner contributions to keep operating.
Why NOI and cash flow can tell different stories:
A property might have strong NOI ($120,000) but negative cash flow if mortgage payments ($140,000) exceed operating profit. The property is operationally healthy but overleveraged with debt.
Conversely, a property with modest NOI ($80,000) but low debt service ($40,000) generates positive cash flow ($40,000) even though operating margins aren’t impressive.
Common Financial Statement Red Flags Property Managers Miss
Certain patterns in financial statements signal problems before they become crises. Knowing what to look for prevents expensive surprises.
Red Flag 1: Rising Vacancy Loss
Your income statement shows increasing vacancy loss month over month. In January, vacancy was $2,000. By June, it’s $8,000.
What this tells you:
Units are sitting vacant longer between tenants, or more tenants are breaking leases early. Either way, you’re losing rental income.
What to do:
Compare your vacancy rate to market averages. Are you below market, at market, or above?
Review your tenant screening process. Are you approving marginal applicants who don’t stay?
Analyze your rent pricing. Are you charging above market rates that extend vacancy periods?
Evaluate your property condition. Are units showing poorly because of deferred maintenance?
Red Flag 2: Maintenance Expenses Climbing Faster Than Income
Your income statement shows rental income grew 3% year over year, but maintenance expenses jumped 25%.
What this tells you:
Deferred maintenance is catching up with you. Small problems you’ve been patching are becoming major repairs.
Your property is aging and moving into a higher-cost maintenance phase.
You’re experiencing tenant-caused damage that indicates screening problems.
What to do:
Review maintenance categories. Is the increase concentrated in specific areas (HVAC, plumbing, roofs)?
Conduct a property-wide inspection to identify deferred maintenance requiring capital investment.
Implement preventive maintenance programs to reduce emergency repair costs.
Consider whether your tenant quality has declined, leading to more damage.
Red Flag 3: Security Deposit Liabilities Don’t Match Assets
Your balance sheet shows $45,000 in security deposits held (asset account) but $52,000 in security deposits payable (liability account).
What this tells you:
You owe tenants $7,000 more in security deposits than you actually have in your trust account. This is a trust accounting violation in most states.
Money that should be in your security deposit trust account has been used for other purposes (commingling).
What to do:
Immediately reconcile your trust account. Identify which security deposits are missing and why.
Contribute personal or company funds to cover the shortfall before a state audit discovers it.
Review your trust accounting procedures. How did this happen? Who has access to trust accounts?
Implement monthly three-way reconciliation (bank statement, liability account, and individual tenant deposit tracking) to prevent recurrence.
Red Flag 4: Accounts Receivable Growing Month Over Month
Your balance sheet shows accounts receivable was $5,000 in January, $8,000 in March, and $12,000 in June.
What this tells you:
More tenants are falling behind on rent, or you’re not collecting effectively.
Your income statement might look okay (you’re recording rent as earned), but you’re not actually receiving the money.
What to do:
Age your receivables. How much is 30 days past due? 60 days? 90+ days?
Review your late rent enforcement procedures. Are you consistently applying late fees and sending notices?
Identify problem tenants. A few chronic non-payers often account for most receivables.
Evaluate whether your tenant screening criteria need tightening. Are you approving applicants with marginal credit?
Red Flag 5: Operating Expense Ratio Above 50%
Your income statement shows gross operating income of $100,000 and total operating expenses of $55,000, giving you an operating expense ratio of 55%.
What this tells you:
Your operating costs consume more than half your income. Industry benchmarks suggest operating expenses should be 35-50% of gross income depending on property type.
You’re either inefficient in operations, undercharging for rent, or facing cost pressures that threaten profitability.
What to do:
Benchmark each expense category against similar properties. Which specific categories are high?
Review vendor contracts. Are you paying above-market rates for services?
Analyze utility usage. Is high consumption indicating inefficient systems or tenant abuse?
Consider whether you can increase rent to improve the ratio from the income side.
How Property Management Software Simplifies Financial Reporting
Creating accurate financial statements manually through spreadsheets or generic accounting software creates enormous opportunity for error and consumes valuable time that could go toward property operations.
Modern property management platforms automate financial reporting through built-in chart of accounts structures, automated transaction categorization, and property-level tracking.
Automated categorization eliminates manual data entry errors:
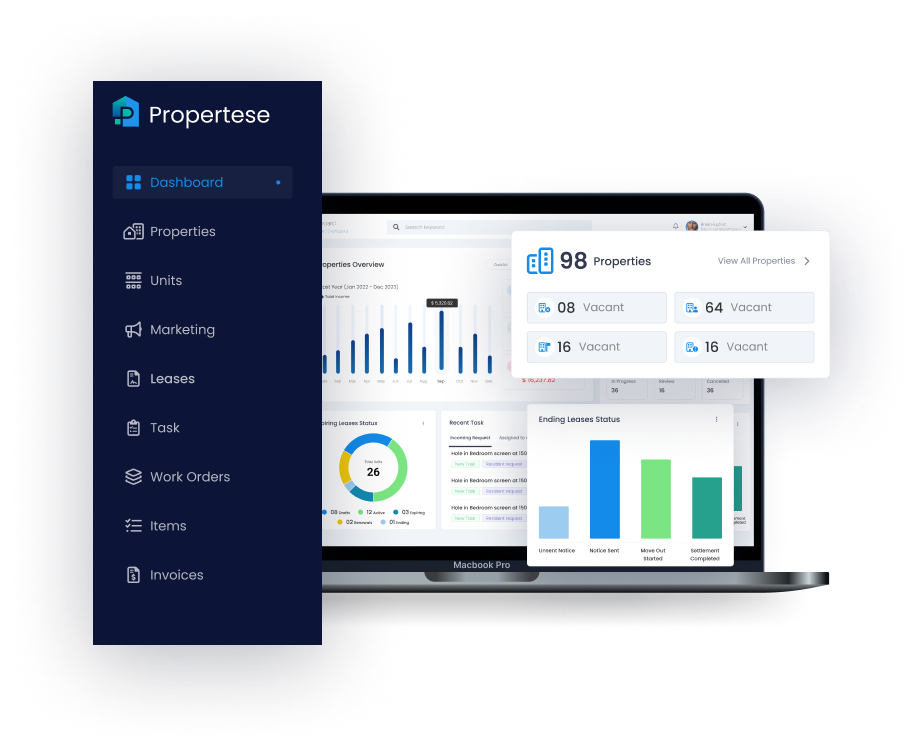
When rent payments come in through Propertese’s rent collection system, the platform automatically splits income into the correct accounts. Security deposits go to trust liabilities. Rent goes to rental income. Late fees categorize separately. You’re not manually deciding where each transaction belongs.
Property-level reporting without manual filtering:
Generate individual property income statements, balance sheets, and cash flow statements instantly. The system maintains property-specific accounting automatically, so you can send each owner their property’s financial reports without manual consolidation work.
Built-in trust account compliance:
Property management software tracks security deposit liabilities by tenant and property, reconciles trust accounts monthly, and flags discrepancies before they become violations.
Real-time financial visibility:
Instead of waiting until month-end closing to see financial results, dashboards display current NOI, cash position, accounts receivable aging, and other key metrics in real time.
Integration with accounting systems:
For property managers who want deeper accounting capabilities, property management platforms integrate with accounting systems. Transactions flow automatically with correct account codes, eliminating double entry.
Property managers using integrated systems report saving 10-15 hours monthly on financial reporting and closing processes while improving accuracy and owner satisfaction.
Your Financial Statement Review Checklist
Use this process monthly to catch problems early and maintain financial control:
Week 1 of Each Month: Close the Prior Month
Review all bank accounts and credit card statements. Ensure every transaction is recorded and categorized.
Reconcile trust accounts. Verify security deposits held equal security deposits payable.
Record any accrued expenses or prepaid items to match the accounting period correctly.
Week 2: Review Income Statement
Compare actual results to budget. Flag any line items more than 10% over or under budget.
Calculate your operating expense ratio. Is it within normal range (35-50%)?
Review NOI trend. Is it improving, stable, or declining compared to previous months?
Week 2: Review Balance Sheet
Confirm trust account balances match liabilities owed.
Age accounts receivable. Follow up on anything over 30 days past due.
Review accounts payable. Are you current with vendors or falling behind?
Week 2: Review Cash Flow
Analyze whether you generated positive or negative cash flow for the month.
Review your ending cash position. Do you have adequate reserves for upcoming expenses?
Forecast next month’s cash needs. Will you have enough to cover planned expenditures?
Week 3: Prepare Owner Reports
Generate property-specific financial statements for each owner showing their property’s performance.
Include key metrics: occupancy rate, NOI, cash flow, accounts receivable status.
Highlight any significant variances from budget or previous periods with explanations.
Week 3: Analyze Trends
Compare current period to same period last year. Are you improving or declining?
Review quarterly and year-to-date numbers. Are you on track to meet annual goals?
Identify any emerging patterns that need attention before they become problems.
The Bottom Line on Reading Financial Statements
Property management financial statements are not just compliance documents you generate for owners and file away. They’re operational tools that tell you exactly how your properties are performing and where problems are developing.
The property managers who build the most profitable portfolios are not those who simply collect rent and respond to maintenance calls. They’re the ones who understand their financial statements well enough to spot a 2% decline in occupancy before it becomes 10%, recognize that maintenance costs are trending upward before they blow the budget, and see that accounts receivable are growing before they become uncollectable bad debts.
Reading financial statements effectively requires understanding what each document shows, what metrics matter most, and what patterns signal problems. The income statement tells you about profitability. The balance sheet shows your financial position and solvency. The cash flow statement reveals whether you’re actually generating or consuming cash.
Master these three reports and the key metrics they contain (NOI, occupancy rate, cash flow, operating expense ratio, accounts receivable aging), and you’ll have complete visibility into your portfolio’s financial health. Ignore them or skim them without real analysis, and you’ll eventually face cash crises, trust account violations, or owner dissatisfaction that could have been prevented.
The good news is that modern technology has made financial reporting significantly easier than it was even five years ago. Property management platforms automate most of the heavy lifting, categorize transactions correctly, maintain property-level separation, and generate reports instantly.
If you’re still creating financial statements through manual processes or piecing together numbers from multiple systems, you’re spending time on administrative work that could be automated while increasing your error risk. Contact Propertese today to see how our platform automates financial reporting across your entire portfolio
Table of Contents
Stay Updated
Subscribe to get the latest news, industry trends, blog posts, and updates...